
Fig. 4.
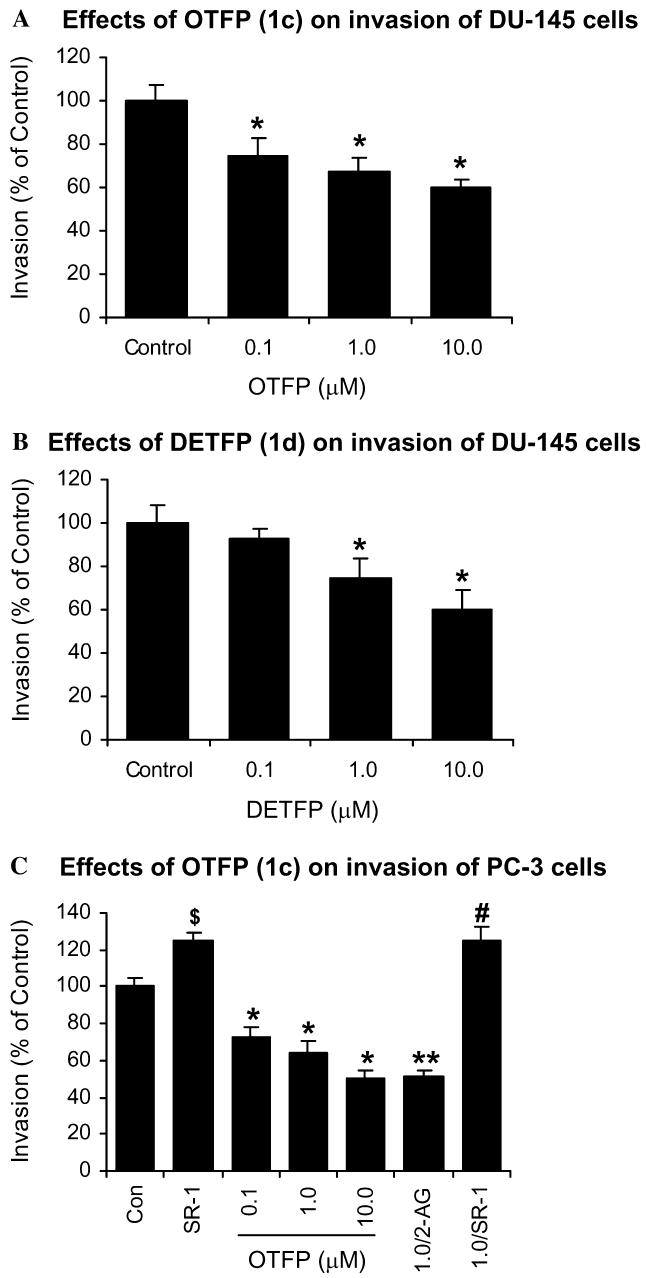
Invasion of PC-3 and DU-145 cells. (A) Cell invasion of DU-145 cells treated with OTFP (1c) (0.1, 1.0, and 10.0 μM). Values are means ± SEM (n = 12). (B) Cell invasion of DU-145 cells treated with DETFP (1d) (0.1, 1.0, and 10.0 μM). Values are means ± SEM (n = 12). (C) Cell invasion of PC-3 cells treated with SR141716 (SR-1) (500 nM), OTFP (0.1, 1.0, and 10.0 μM), OTFP (1.0 μM) + 2-AG (1.0 μM), and OTFP (1.0 μM) + SR141716 (SR-1) (500 nM). Values are means ± SEM (n = 18). $Significantly higher than control with p < 0.05; *significantly lower than control with p < 0.01; **significantly lower than OTFP (1.0 μM) with p < 0.05; #significantly higher than OTFP (1.0 μM) with p < 0.005.