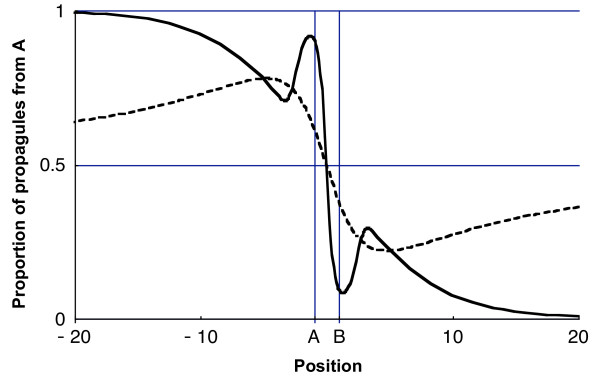
Figure 2.

Proportion πA of propagules from source A. Proportion of propagules from source A as a function of position x between -20 m and 20 m for two dispersal kernels:hatched line, 1-dimensional 2Dt with a = 3 and α = 4.7; solid line, mixture of two Gaussians with p = 2/3, α1 = 1 and α2 = 4. The mean distance travelled is the same for both kernels and equals 2 m.
