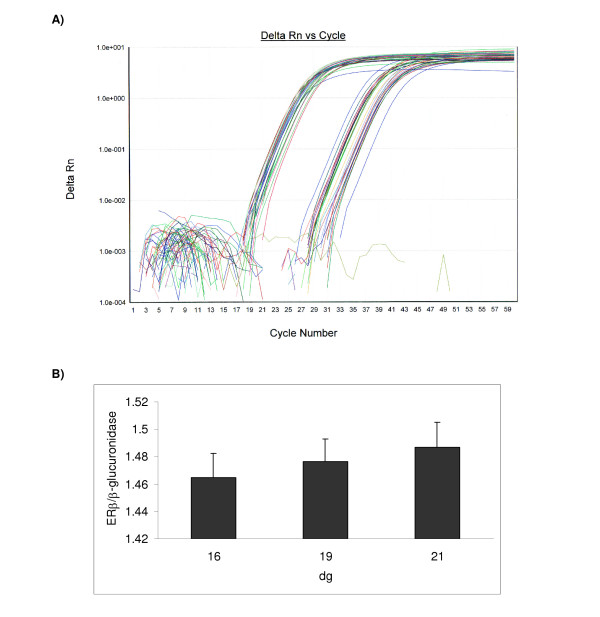
Figure 2.
Expression of ERβ transcript in rat placentae during gestation. [A] ReT-PCR analysis for ERβ and β-glucuronidase. A graph showing delta Rn (change in normalized reporter expression) as a function of cycle number. Reactions were performed for 60 cycles at 60°C, using recommended conditions by supplier. Samples were run in duplicates for both target and endogenous genes. [B] Relative ERβ gene expression. The average threshold cycle (CT) for duplicate samples was expressed relative to that of β-glucuronidase. Results shown are mean ± S.E.M. (n = 4). No significant change in ERβ gene expression was detected.

