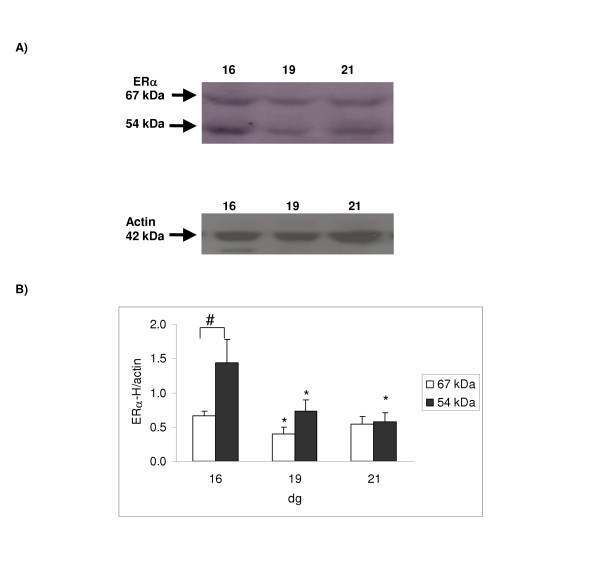
Figure 3.
Protein expression using a monoclonal antibody (ERα-H) raised against the ERα hinge region. 100 μg of protein was loaded. [A] Representative Western blot for ERα and actin (which was used as an internal standard for normalizing the data); the calculated size of the band is indicated on the left-hand side of the gel. Two bands of apparent molecular weights of 67 and 54 kDa were detected for ERα. [B] Ontogenic profile: ERα protein was expressed relative to actin. Results shown are mean ± S.E.M. from four different dams; a significant decrease in ERα protein expression was detected between 16 and 19 dg for the 67 kDa band (*p < 0.05). For the 54 kDa band a significant decrease in ERα protein expression was detected between 16 and 19 dg and 16 and 21 dg (*p < 0.05). The 54 kDa band had a higher expression at 16 dg when compared to the 67 kDa band (#p < 0.001; LSD test).

