
Figure 2.
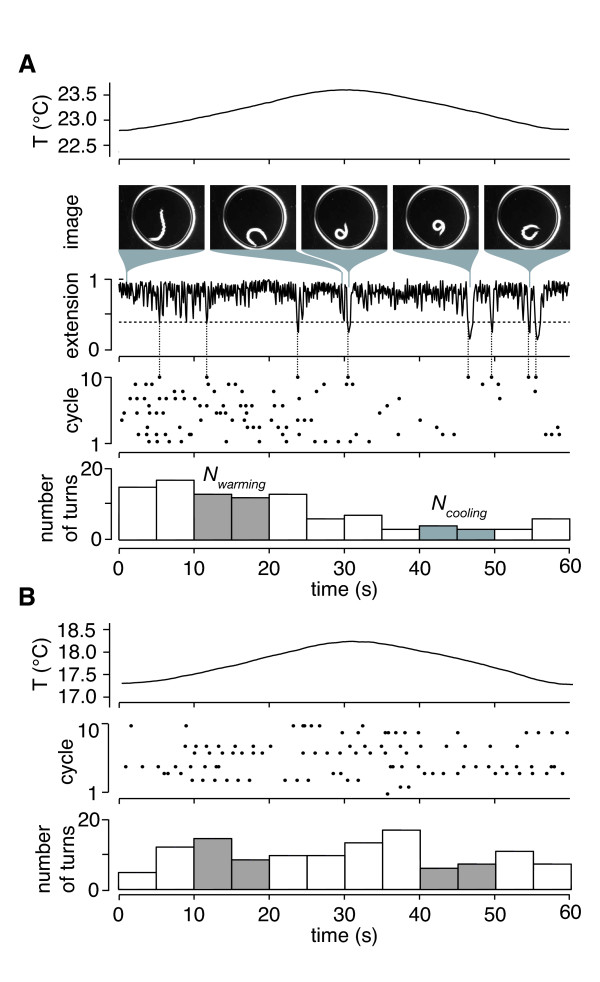
Microdroplet assay. A. Sample data of cryophilic bias at temperatures above Tcult. The top panel shows the sinusoidal thermal cycle recorded at the microdroplet. Sample video frames depict worm conformation and the corresponding body extension; dips of body extension below a threshold are counted as reorientation events. A time series of reorientation events is presented in the fourth panel as a raster of all cycles. The bottom panel is a histogram of reorientation events, showing the distribution of reorientations with respect to the thermal cycle. To avoid sensitivity to possible behavioral phase delays, we use the data from the 10 s in the middle of warming and cooling intervals (dark histogram bars). The tendency to reorient more frequently during the warming phase than the cooling phase of the thermal cycle reveals cryophilic bias. B. Sample data of unbiased movement below Tcult. Reorientations occur randomly throughout the thermal cycle, showing that this worm is not exhibiting thermophilic or cryophilic bias.