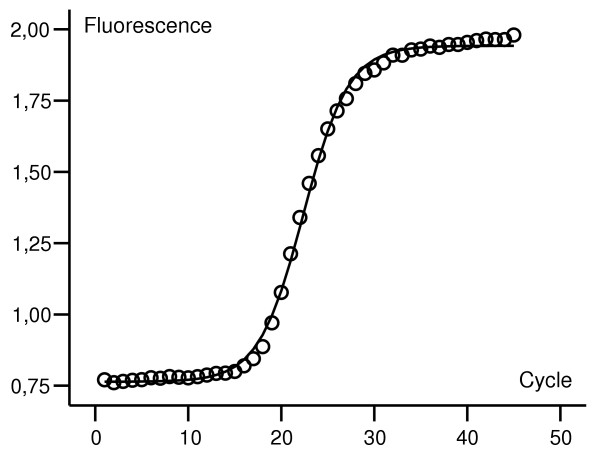
Figure 1.

Sigmoidal curve fitting. A sigmoidal curve fit of fluorescence data from a real-time experiment (ACTB). Observed fluorescence plotted as data points (o), predicted fluorescence shown as a curve. The data set in this example is not background corrected.
