
Figure 2.
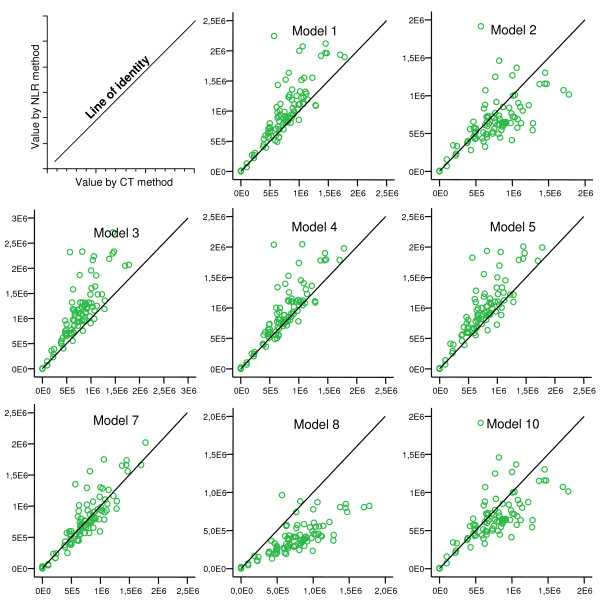
Plots of copy numbers by NLR vs. CT. ACTB mRNA measured by real-time PCR on extracts from human gastric mucosa. Plots show values (copies/μL) derived by NLR (Y-axis) vs. by CT (X-axis). A line of identity is inserted in each plot. Models that produced one or more bad fits are not shown.