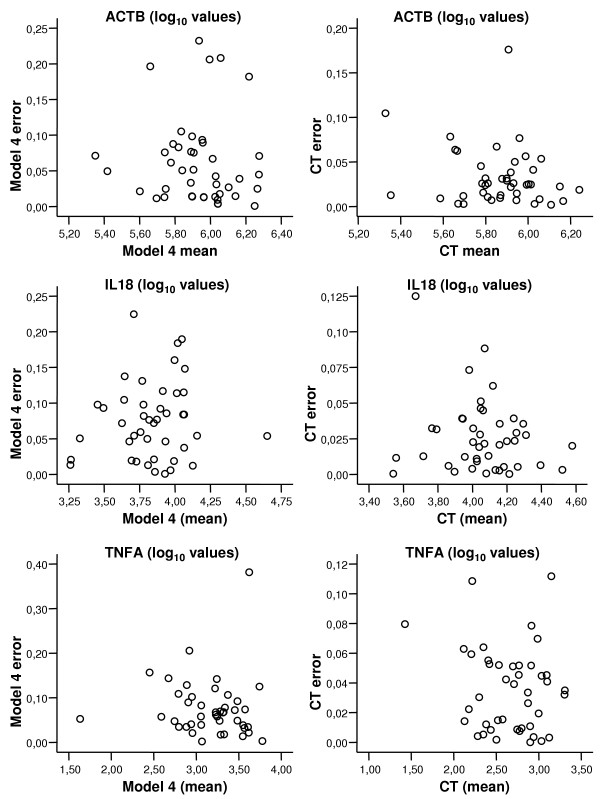
Figure 4.

Intra-assay variation by the NLR (model 4) and by the CT method. Real-time RT-PCR data for ACTB, IL18 and TNFA on RNA extracts from human gastric mucosa. Plots show intra-assay variation or error (difference between duplicate values) vs. mean (of duplicates) calculated from log10 transformed copy number values. The left column is NLR data from model 4, the right column is CT-derived values. The errors observed seem to be independent of mean values. A 95 percentile of these data can then be calculated for evaluation of assay performance. Generally, the intra-assay variation is lower in CT-method derived values.
