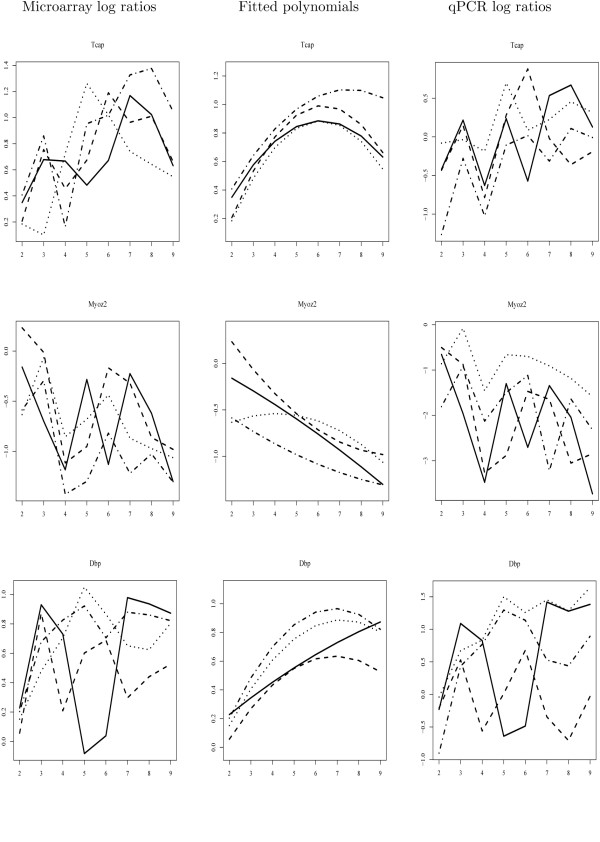
Figure 4.

Validation of the temporal Hotelling T2-test with quantitative PCR experiments (2). The expression patterns of Tcap and Myoz2 (significant in non-temporal but not in temporal test), and Dbp (significant in non-temporal test and temporal test with higher order polynomials), as determined by microarray and qPCR assays, are plotted. The left panel shows the log-ratios with respect to time point 1 estimated from the microarray data; the middle panel shows the fitted second order polynomials; the right panel shows the log-ratios determined by quantitative PCR, as an independent confirmation method for the microarray data. X-axis represents time points. Solid lines represent WT mice; dashed lines MDX mice; dotted lines BSG mice; dashed line interrupted with dots GSG mice.
