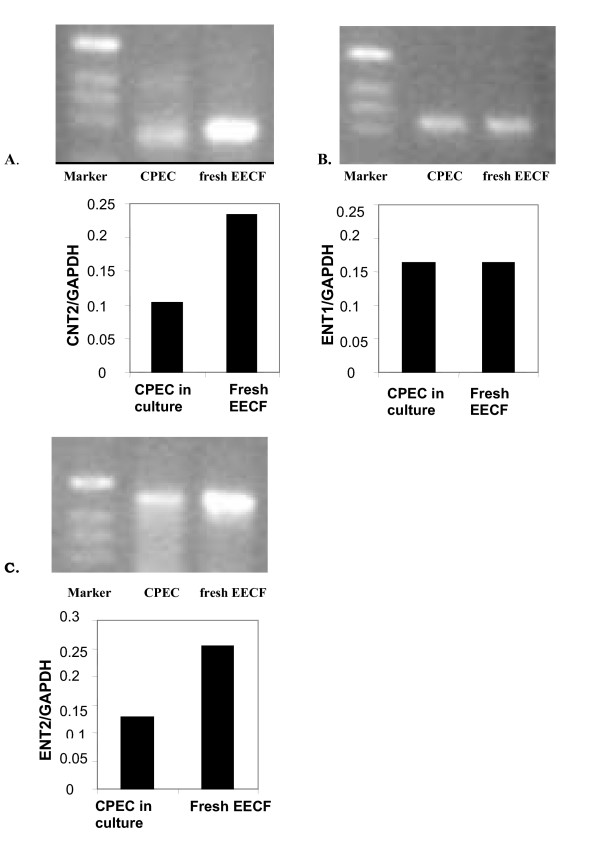
Figure 5.
The expression of (A) CNT2, (B) ENT1, and (C) ENT2 at the transcript level in the 8d-old CPEC in primary culture and in the fresh EECF. All gels revealed bands corresponding to these nucleoside transporters in both fresh EECF and CPEC in primary culture. They were also present in samples from whole brain homogenate (positive control, not shown in the figure). The amount of mRNA for these proteins was expressed relative to the amount of mRNA for the housekeeping protein GAPDH and the mean values are presented as bars. The apparent amount of mRNA for GPADH did not differ between fresh EECF samples and samples from CPEC in primary culture. The relative expression of mRNA for ENT1 was the same in CPEC in primary culture as in EECF; however, relative expressions of mRNA for two other proteins were 40–50% lower in CPEC than in EECF.

