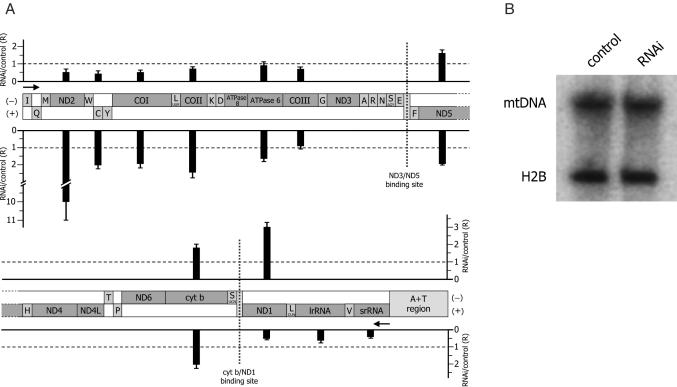
Figure 4.
Effect of DmTTF depletion on the level of mitochondrial sense and antisense transcripts, and on mtDNA copy number. (A) Relative quantification of mitochondrial RNAs by real-time RT–PCR. MtDNA molecule is represented as a linear map. Transcription direction of (−) and (+)strand is indicated by black arrows; the two DmTTF-binding sites are marked by vertical dotted lines. Black bars reported above (−)strand and below (+)strand, in correspondence of the analyzed genes, indicate the relative content (R) of sense and antisense transcripts, normalized to 28S rRNA (endogenous control), in DmTTF depleted (RNAi) with respect to control cells, fixed as value 1. The relative quantification was performed according to the Pfaffl equation R = (ET)ΔCt,T/(EC)ΔCt,C (24), where ET is the amplification efficiency of target gene transcripts; EC is the amplification efficiency of endogenous control; ΔCt,T and ΔCt,C are the differences between Ct of the control and Ct of the RNAi sample for target gene transcripts and for endogenous control, respectively. For each amplicon, the mean ratio value was obtained from at least four real-time RT–PCR assays, using RNA obtained from independent RNAi experiments; standard deviations are indicated on the top of the bars. Statistical analysis showed that the differences between RNAi and control are all significant (P < 0.05) except for ATPase6/8 and COIII-antisense transcript. (B) Southern blotting analysis of mtDNA. Total DNA (5 µg) from untreated (control) and treated (RNAi) D.Mel-2 cells was digested with XhoI, fractionated on a 0.7% agarose gel and electroblotted to nylon membrane. The filter was hybridized with radiolabeled probes for both mitochondrial ND3 gene and nuclear H2B histone gene (endogenous control). The amount of c.p.m. used for each probe was such to obtain a comparable signal for mitochondrial and nuclear DNA.

