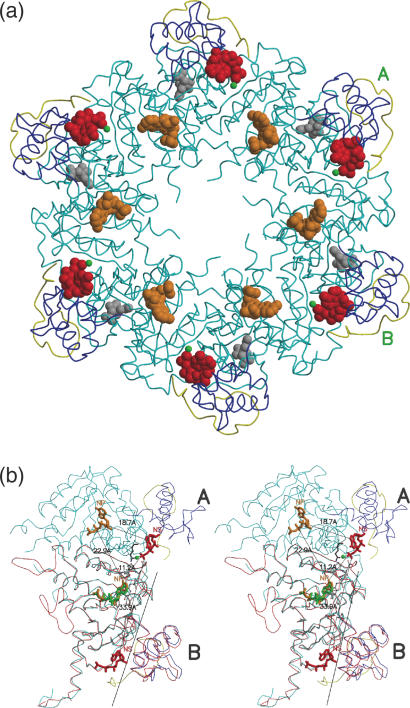
Figure 1.
Filament formation in MsRecA. C* is coloured in yellow. The rest of the C domain is in blue. The nucleoside triphosphates dATPI, dATPII and citrate molecules are coloured in orange, red and grey. The magnesium ion is shown in green. (a) Cross sectional view. (b) Stereo view of a blow up of subunits A and B. The subunit B of this structure is superposed with a subunit of MsRecA-I (red). Residues connecting dATPII in A and dATPI in B are shown in ball-and-stick representation. The rotation axis about which the C domain moves, is also shown. The primary and the secondary nucleotide-binding sides are labelled NP and NS, respectively. The distances among the sites in the two subunits are indicated.

