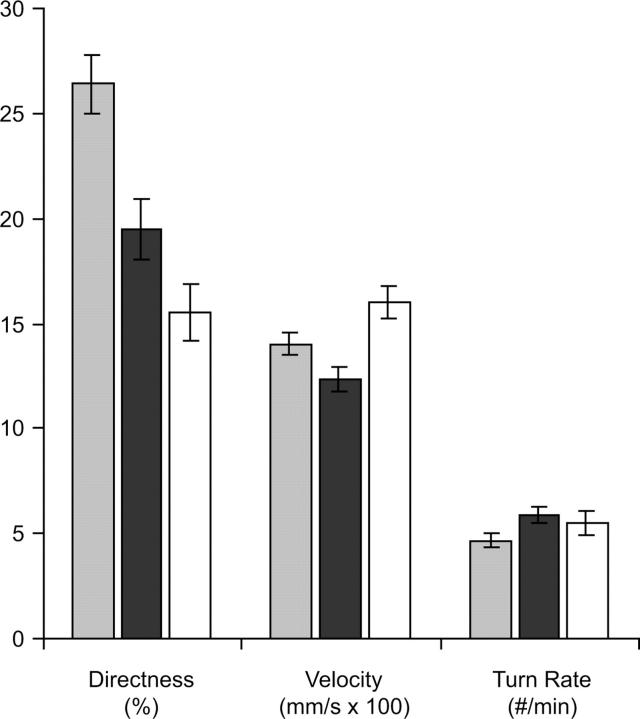
Figure 2.—
Change in behavior after 370 generations of mutation accumulation. Average values for the unmutated control (shaded bar), the mutation accumulation lines (solid bar), and the control in the absence of the repellent chemical (open bar) are given. Behavior strongly declines under the accumulation of spontaneous mutations, either becoming more similar to the control in the absence of a stimulus (directness and turn rate) or simply showing an overall degradation in response (velocity). Error bars are 95% C.I.

