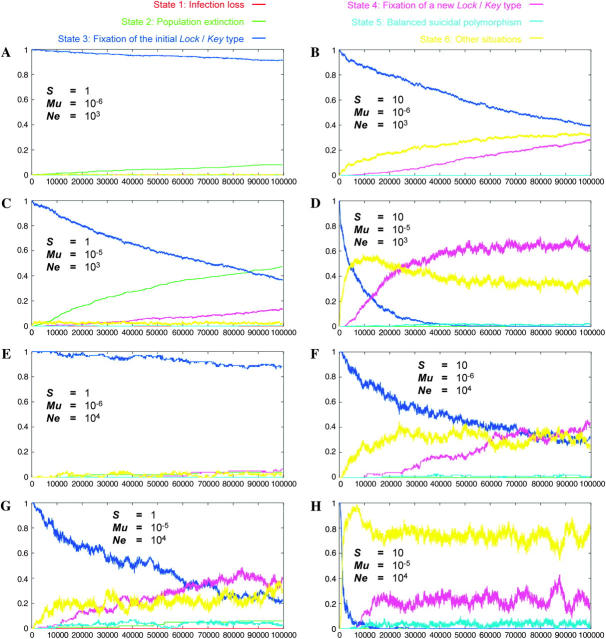
Figure 8.—
The evolution of population states over 100,000 generations, for two different S-values (S = 1 and S = 10), two different Mu-values (Mu = 10−6 and Mu = 10−5), and two different Ne-values (Ne = 103 and Ne = 104). The curves plot the frequency of population states (y-axis) as a function of time (100,000 generations, x-axis), calculated over 500 simulation runs (A–D) or 100 simulation runs (E–H). Initial population: one single variant, totally self-compatible, with MI = 1, TE = 1, FE = 1, lock = 1111111111, key = 1111111111. The values of S, Mu, and Ne are given in A–H. Other parameters values are n = 10 and MImax = TEmax = FEmax = 1. Note that for the lock and key parameters, Mu is multiplied by S so that Mu gives the mutation rate per site.

