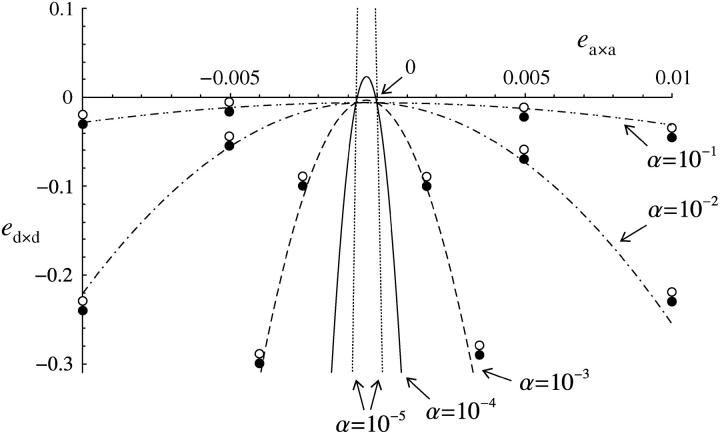
Figure 5.—
Maximum value of dominance × dominance epistasis (ed×d) for a modifier increasing recombination to be selected, under sporophytic selfing and under the fitness matrix given in Table 2, as a function of additive × additive epistasis (ea×a). The curves correspond to our analytical result for weak epistasis and weak selfing (Equation 49), for α = 10−5 (dotted curves), 10−4 (solid curve), 10−3 (dashed curve), 10−2 (dashed-dotted curve), and 10−1 (dashed-double-dotted curve). Circles correspond to simulation results for α = 10−3, 10−2, and 10−1: solid circle, the modifier increases in frequency when rare; open circle, it decreases in frequency. Parameter values are: rij = rjk = 0.2, s = −0.1, h = 0.1; in the simulations dr = 0.01, hM = 1/2, ea×d = 0.01, u = 10−5.

