


TABLE 2.
Probability  depending on flanking marker genotypesgs−1,i,j−1,gs−1,i,j,gs,i,j−1, andgs,i,j for 1 <j <l + 1
|
gs,i,j−1, gs,i,j
|
||||||||
|---|---|---|---|---|---|---|---|---|
| gs−1,i,j−1, gs−1,i,j | 1, 1 | 1, 0 | 0, 1 | 0, 0 | ||||
| 1, 1 |
|
|
|
|
||||
| 1, 0 | 0 | 1 − r*1 | 0 | r*1 | ||||
| 0, 1 | 0 | 0 | 1 − r*2 | r*2 | ||||
| 0, 0 | 0 | 0 | 0 | 1/2 | ||||
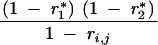


a
 and
and  .
.