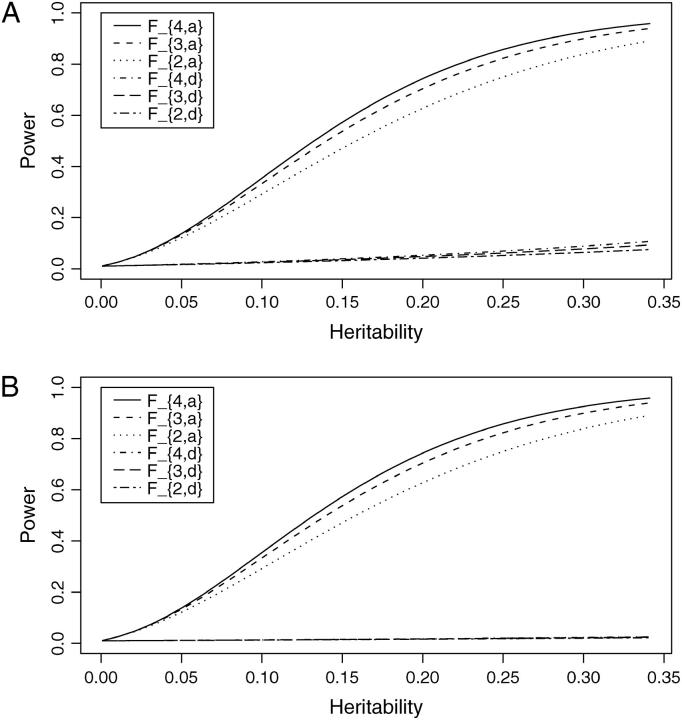
Figure 2.—
Power of test statistics F4,a, F3,a, F2,a, F4,d, F3,d, and F2,d against the heritability h2 at a 0.01 significance level, when q1 = 0.5,  , i, j = 1, 2, 3, 4, i ≠ j, π12Q = 0.5, δ12Q = 0.25,
  and sample size n = 40, m = 30, s = 20 for (A) a dominant mode of inheritance a = d = 1.0 and (B) a recessive mode of inheritance a = 1.0, d = −0.5, respectively.

