Figure 3.—
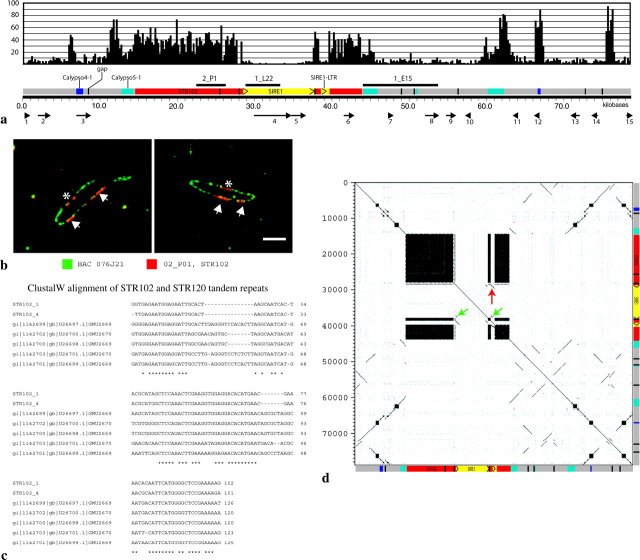
Sequence analysis of BAC 076J21. (a) Schematic of BAC 076J21 (79,623 bp). Black bars above sequence diagram are the subclones used for Southern analysis and FISH. Across the top, a 200-bp sliding window (x-axis) was used to map the number of BLASTN hits (y-axis) from a search against the soybean GSS sequences along the length of 076J21. FGENESH-predicted genes are shown with arrows along the bottom of the diagram. (b) Digital mapping of 2_P01 [STR102] onto BAC 076J21 using FISH. Three clusters are seen, two of which (arrows) may border the SIRE1 element. The other (star) did not assemble into the sequence scaffold. (c) ClustalW was used to align two representatives of the STR102 repeat (STR102_1 and STR102_4) with five STR120 members from GenBank. Asterisks denote complete identity among all seven sequences at a nucleotide position. (d) A dot plot was made using Dotter (Sonnhammer and Durbin 1995) with a word size of 20 nt of 076J21 against itself. A schematic of the BAC with internal structures is shown on both axes. The LTRs of the SIRE1 element are indicated with green arrows and the solo LTR with a red arrow.

