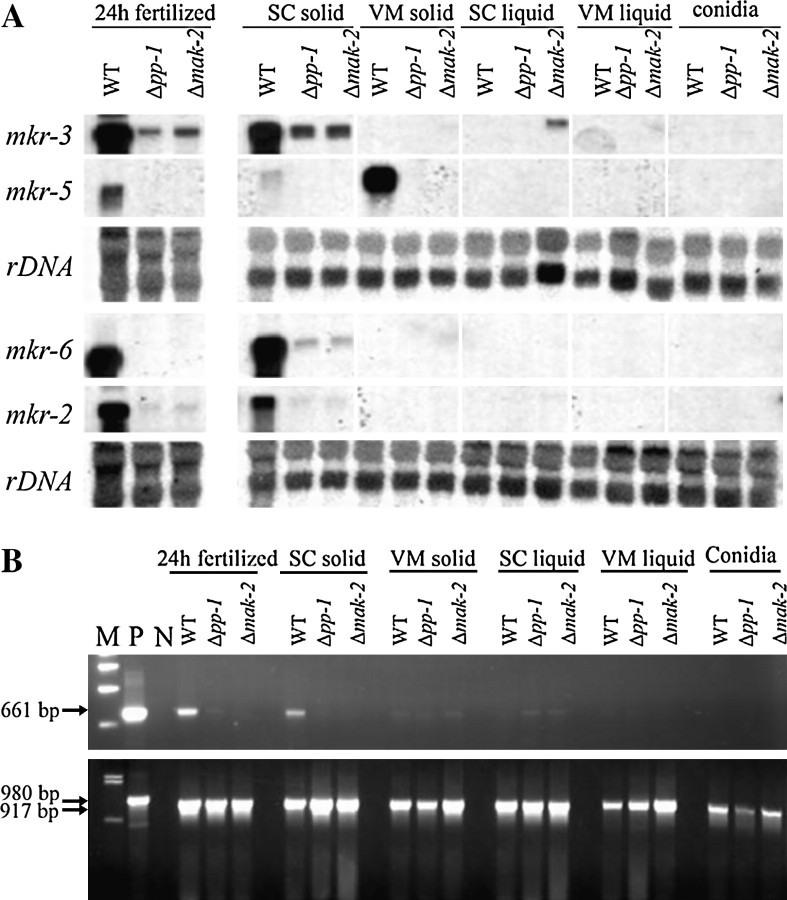
Figure 4.—
Expression patterns of the pks/mkr gene cluster in the WT, Δpp1 mutant, and Δmak-2 mutant. Strains were grown on SC solid medium for 7 days at 25° (SC solid), and then fertilized with 74-ORS6a conidia for 24 hr at 25° (24 hr fertilized), on VM solid medium for 7 days at 34° (VM solid), in SC liquid medium for 24 hr with 250 rpm shaking at 34° (SC liquid), in VM liquid medium for 24 hr with 250 rpm shaking at 34°. RNA was extracted from harvested cultures and from conidia. (A) Northern hybridization analysis. RNA blots were hybridized in succession with probes for mkr-3, mkr-5, mkr-6, and mkr-2. The blots were then hybridized with a rDNA probe to check the relative amount of RNA in each sample. (B) RT-PCR analysis of pks gene expression. PCR was performed with genomic DNA as a positive control (P) and no template as a negative control (N). The ΛDNA-BstEII digest ladder (New England Biolabs) was used to estimate the size of the PCR products (M). A 661-bp pks fragment (indicated by the arrow) was amplified with the gene-specific primers PDL21 and PDL22 using the first-strand cDNA as a template (top). The same cDNA samples were also used for RT-PCT with a primer pair specific for the actin gene, which was used as a control (bottom). The arrows indicate the PCR products amplified from gDNA (980 bp) and cDNA (917 bp).

