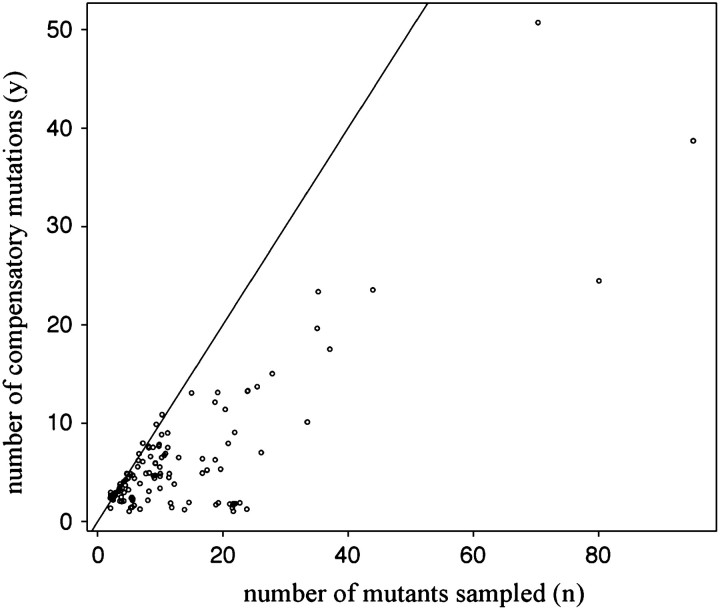
Figure 1.—
Relationship of the number of different compensatory mutations (y) observed at least once in a random sample of n mutants. Each point corresponds to a unique initial mutation from which compensatory mutations are subsequently derived in one or more studies. All points have been displaced by a small random amount so that multiple overlapping points can be discerned. A solid line at y = n is drawn to emphasize the increasing rate of resampling particular compensatory mutations with larger sample sizes. Five initial mutations for which no compensatory mutants were recovered despite extensive sampling are omitted, having no sample number of mutants specified.

