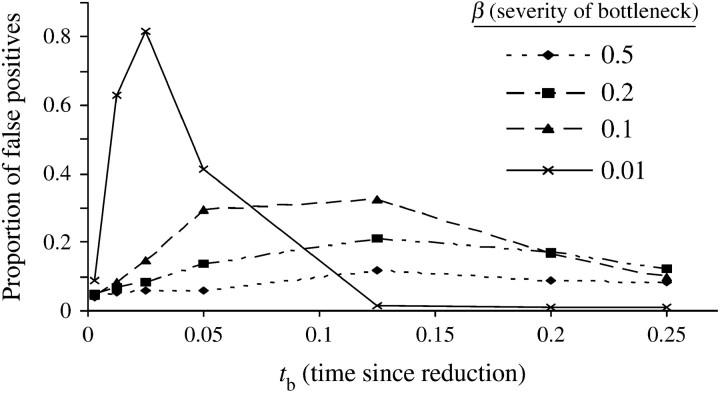
Figure 1.—
Proportion of bottleneck simulations that rejected neutrality in favor of selection using the CLR test. The various lines (solid, dashed, etc.) denote the reduction in population size at the time of the bottleneck for the different scenarios considered. All simulations, unless otherwise specified, have fixed parameters n = 15, θ = 75, and 4Nr = 1000, as specified in methods.

