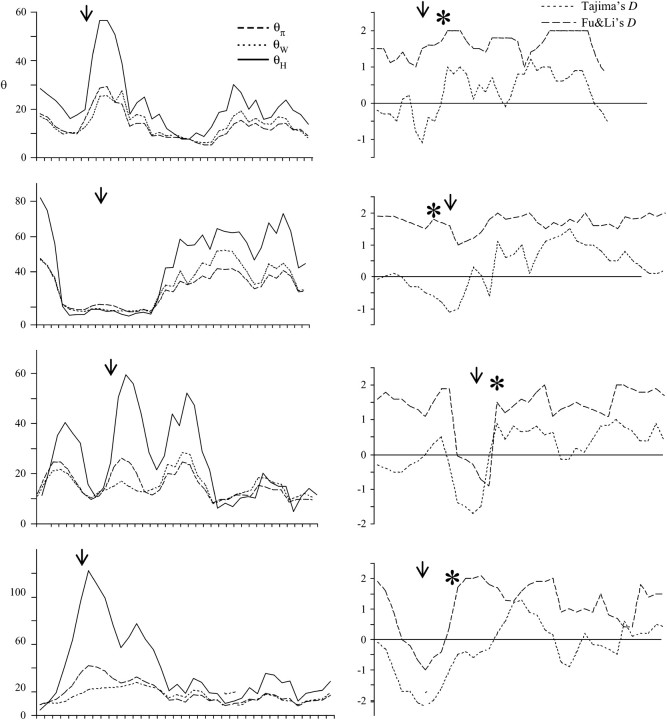
Figure 4.—
Estimates of θ and neutrality test statistics across the 10-kb simulated sequence, depicting the frequency spectrum of variation for population structure simulations that rejected neutrality with the CLR test. Data for each panel were simulated with n = (15, 0), M = 0.1. The particular simulation results shown were chosen at random. Note that Fay and Wu's H-statistic is strongly negative across these regions, ranging from −25 to −98, and is thus not plotted as it would be off scale. Each asterisk denotes the position of the most negative window for Fay and Wu's H-statistic and each arrow shows the predicted location of the putative sweep.

