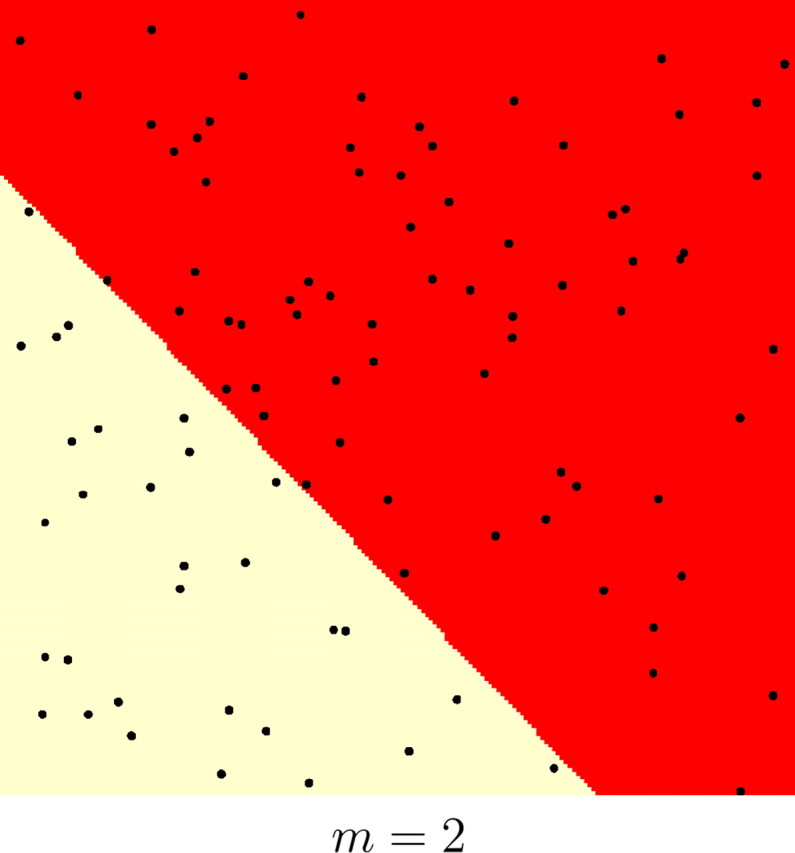
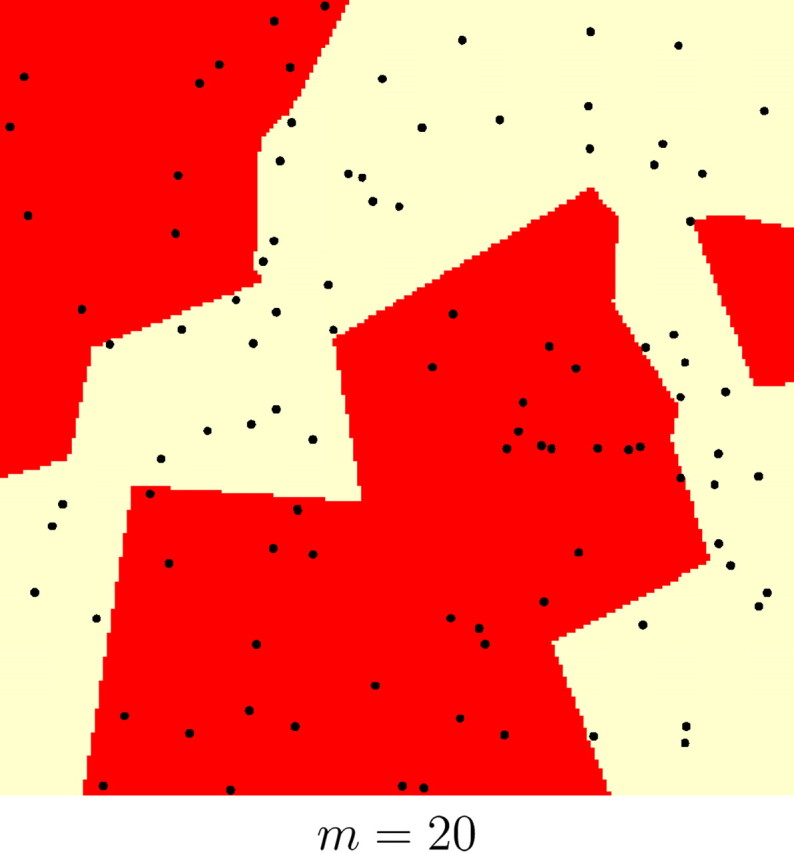
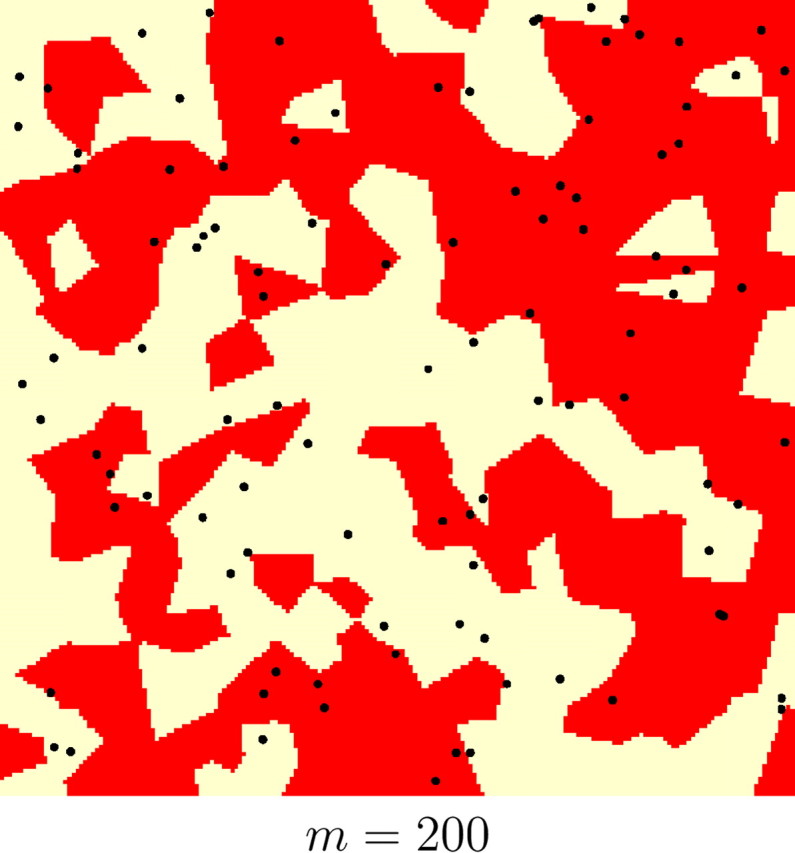
Figure 6.—


Examples of simulated spatial organization of 100 individuals (black dots) into two populations (coded as two colors) with various levels of spatial dependence. This level is controlled by parameter m (number of Voronoi tiles). The nuclei of the tiles are not depicted for clarity.
