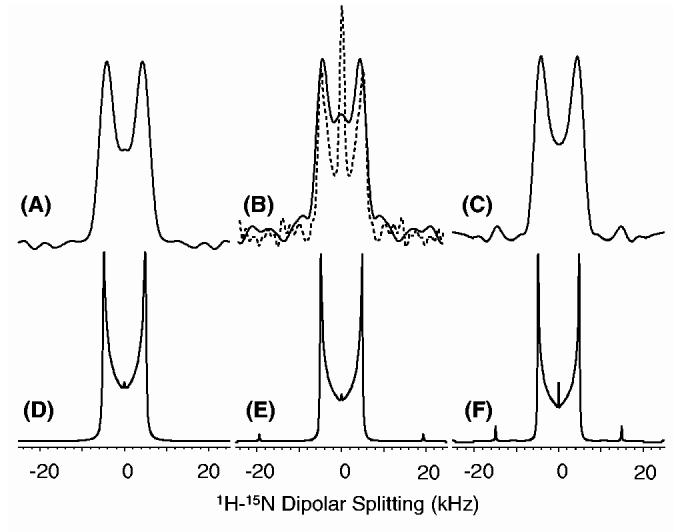
Fig. 3.

Experimental (A, B and C) and simulated (D, E and F) 1H-15N dipolar coupling spectral lines obtained using the 2D PITANSEMA-MAS sequence (Fig. 1D) under 7 kHz MAS. Experimental spectra were obtained from an n-acetyl-d,l-15N-valine powder sample. A 50 kHz rf field for the preparation period, a 62.5 kHz rf field with an offset of 44.19 kHz for FFLG in the t1 period, and a 62.5 kHz TPPM decoupling of protons during the 15N signal acquisition were used. Other experimental parameters include a 0.5 ms cross-polarization time, 64 t1 experiments, 4 scans and a 4 S recycle delay. (τ1, τ2) Values of (30.76 μs, 15.38 μs), (23.08 μs, 11.54 μs) and (15.38 μs, 7.69 μs) were used to obtain spectra (A and D), (B and E) and (C and F), respectively. Scaling factors of 0.232, 0.361 and 0.470 were used for (A and D), (B and E) and (C and F), respectively. The dashed line spectrum in B was obtained using 3-cycles while all other spectra (solid line) were obtained using 1-cycle of TANSEMA-MAS.
