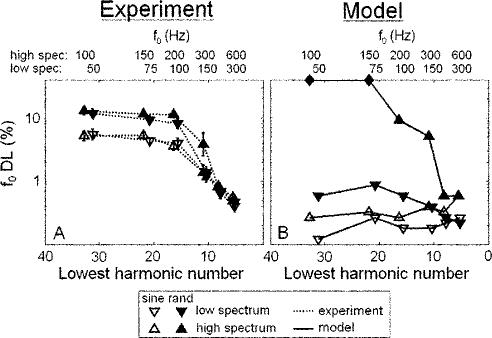
FIG. 1.
Fundamental frequency DLs(a) measured psychophysically and (b) predicted by the optimal detector autocorrelation model, as a function of the lowest harmonic number present within the passband. Stimulus f0's corresponding to the lowest harmonic numbers are listed at the top. Optimal model predictions in (b) are calculated as the minimum value of δ such that d′ exceeds the value of d0′=190 depicted in Fig. 3. Closed diamonds plotted along the top horizontal axis indicate that d0′ was not reached at the maximum tested value of δ=0.3.

