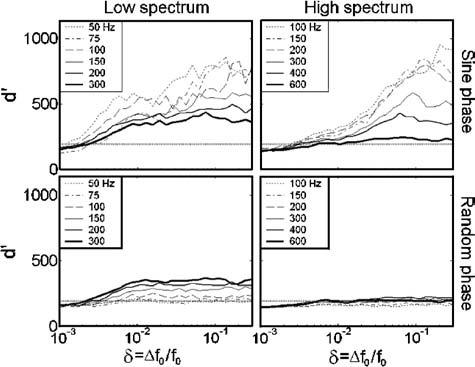
FIG. 3.

Plots of the estimated d′ as a function of δ, the fractional change in f0, as predicted by an optimal detector model. For sine-phase stimuli, slopes decrease with increasing f0, while for random-phase stimuli, slopes increase with increasing f0. Horizontal dotted lines indicate the arbitrary used to predict f0 discrimination thresholds plotted in Fig. 1(b). The plots rarely cross, indicating that the predicted f0 DL vs f0 trend is independent of the chosen value of .
