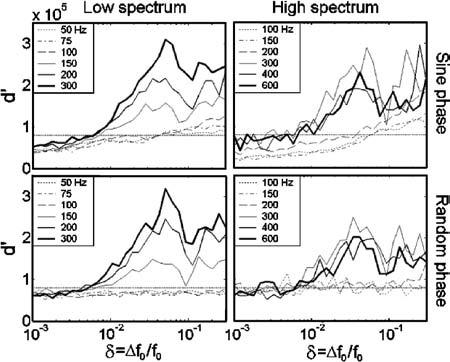
FIG. 6.

Model estimates of d′ vs δ using the lag windows described in Eq. (6) and pictured in Fig. 5, with parameters NC=10.8, NΔ=2, and A=200 that best fit the sine-phase data. Stimulus f0's are clearly divided into two groups, with lower f0's yielding gradual d′ slopes, and higher f0's yielding steeper d′ slopes.
