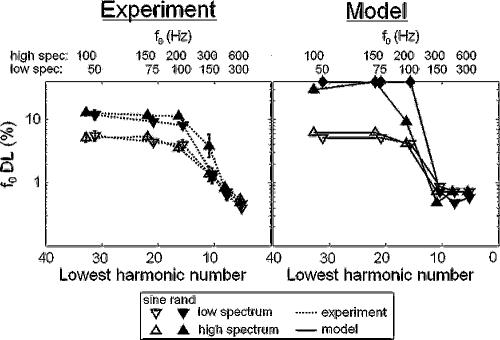
FIG. 7.
(a) Psychophysical f0 DLs from Fig. 1(a) are replotted for direct comparison with the model predictions. (b) Model f0 DL predictions based on d′ estimates shown in Fig. 6 using the lag window [Eq. (6)], plotted as a function of N. As in Fig. 1, f0's corresponding to values of N for the lowand high-spectrum conditions are plotted above each panel, and closed diamonds plotted along the top horizontal axis indicate that d′0 was not reached at the maximum tested value of δ =0.3. Both experimental and model f0 DLs generally overlap for stimuli with the same N, indicating the modified model successfully accounts for effects of N on f0 discrimination performance.

