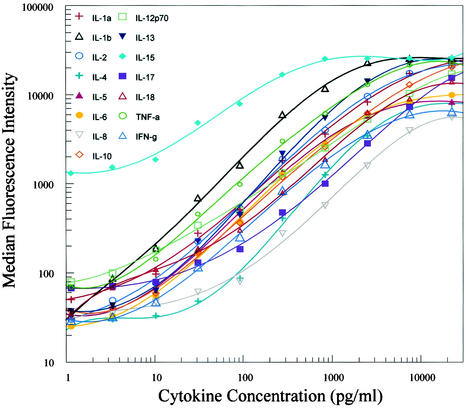
FIG. 1.
Standard curves for recombinant cytokines. Data were generated by combining a threefold dilution of the standards starting at 22,500 pg/ml, coupled beads, and biotinylated antibodies in a 70-μl matrix solution incubated for 20 min. SA-PE was added after two washes and incubated for 10 min. After an additional wash, the median fluorescence intensity was measured with the Bio-Plex system. Standard curves were calculated with Bio-Plex Manager software by a five-parameter regression formula.

