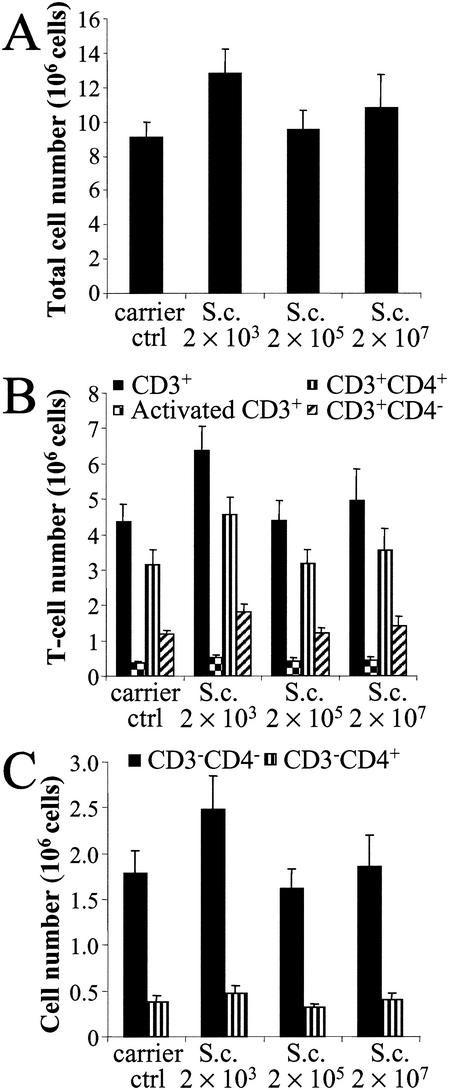
FIG. 3.
Total cell (A), T-lymphocyte (B), and CD3− cell (C) numbers in lymph nodes 24 h after the last (sixth) instillation of graded doses of S. californicus spores (2 × 10³, 2 × 10⁵, and 2 × 10⁷) at 7-day intervals (n = 5 to 6). Carrier ctrl, carrier control; S.c., S. californicus. Each column represents the mean + standard error.

