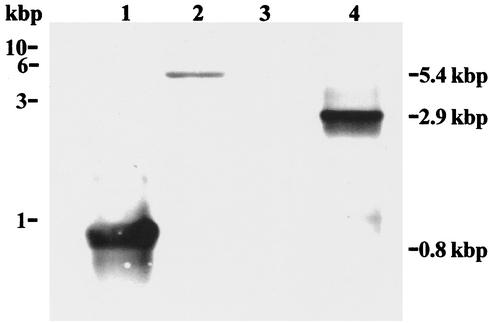
FIG. 1.
Southern analysis of the cloned B. burgdorferi spoT. A DIG-labeled spoT probe (see Materials and Methods) was used to probe a Southern blot containing the PCR product of spoT F1 and spoT R1 primers, which yielded a 0.8-kbp band (lane 1); B. burgdorferi genomic DNA digested with the restriction endonucleases EcoRI and EcoRV, yielding a 5.4-kbp band (lane 2); pBAD24 digested with the restriction endonucleases PstI and SalI (negative control) (lane 3); and pBAD24.spoT digested with PstI and SalI, yielding a 2.9-kbp band (lane 4). The positions of DNA size markers are shown on the left in kilobase pairs (kbp). The sizes of the detected DNA bands are shown on the right.

