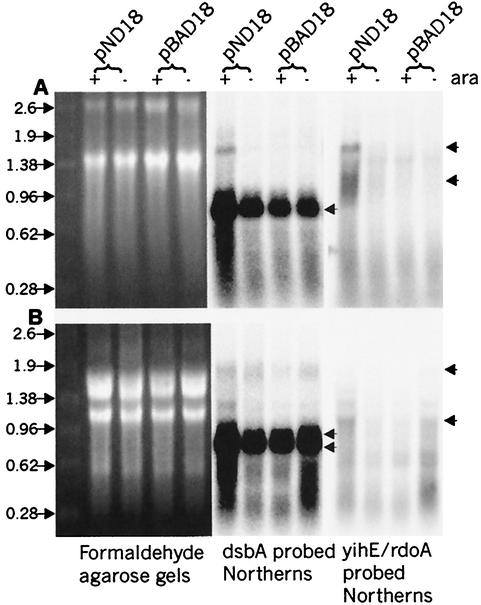
FIG. 4.
Transcript analysis of yihE, rdoA, and dsbA in serovar Typhimurium and E. coli. RNA formaldehyde agarose gels show total RNA amounts loaded in each lane. E. coli (A) and S. typhimurium (B) cells containing pBAD18 (control) vector or pND18 (NlpE-overexpressing plasmid) induced (+) with 0.4% arabinose or uninduced/repressed (−) with 0.2% glucose are analyzed. The left panels show the agarose gels, while the right panels show the corresponding Northern blots of a single membrane probed with either a dsbA probe or a yihE/rdoA probe. Cotranscript (approximately 1.8 kb) was detected using an E. coli dsbA probe or a yihE probe (upper arrow, panel A) and a serovar Typhimurium dsbA probe (upper arrow, panel B). The most abundant transcript in both organisms is dsbA, with one transcript of approximately 0.8 kb in E. coli and two transcripts of approximately 0.7 and 0.8 in serovar Typhimurium (double arrows, panel B). The yihE or rdoA transcripts of approximately 1.0 kb are indicated with arrows for both organisms. In serovar Typhimurium, fragmentation of the 23S rRNA occurs, which results in a different rRNA banding pattern than is seen with E. coli rRNA (27).

