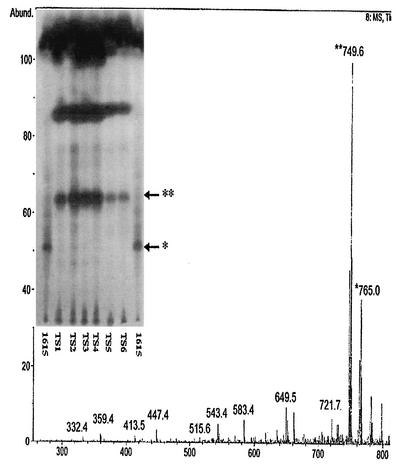
FIG. 2.
Comparison of ASLs extracted from six Australian isolates of M. ulcerans (TS-1 to TS-6) with ASLs extracted from M. ulcerans 1615. Silica TLC was run in chloroform-methanol-water (90:10:1, vol/vol/vol) and visualized by oxidative charring in a ceric molybdate-10% sulfuric acid stain (insert). Mass spectroscopic analysis of ASLs from TS-2, showing the presence of mycolactone C as a major peak at m/z 749.6 along with the presence of mycolactone A/B at m/z 765.0, is shown. ∗, mycolactone A/B; ∗∗, mycolactone C, core lactone; Abund., % abundance.

