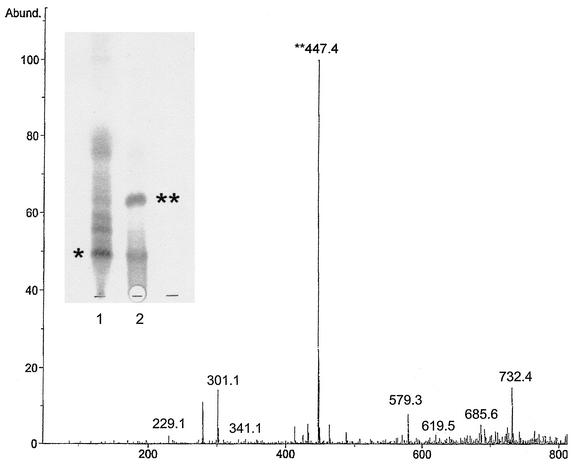
FIG. 5.
Mass spectroscopic analysis of the upper band containing the core lactone product. (Insert) Results of silica TLC, showing products of base hydrolysis of mycolactone and hydrolysis products, are shown. Lane 1, mycolactone starting material; lane 2, hydrolysis products; ∗, mycolactone; ∗∗, core lactone; Abund., % abundance.

