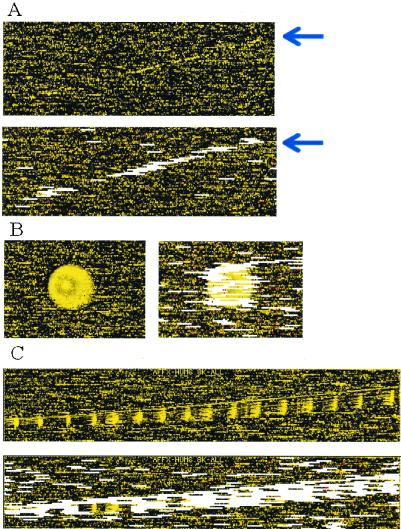
Figure 5.
(A) A long scratch contamination (indicated by arrow) is alleviated by automatic outlier exclusion along this scratch. (B and C) Regional clustering of array outliers (white bars) indicates contaminated regions in the original images. These outliers are automatically detected and accommodated in the analysis. Note that some probe sets in the contaminated region are not marked as array outliers, because contamination contributed additively to PM and MM in a similar magnitude and thus cancel in the PM–MM differences, preserving the correct signals and probe patterns.

