Figure 8.

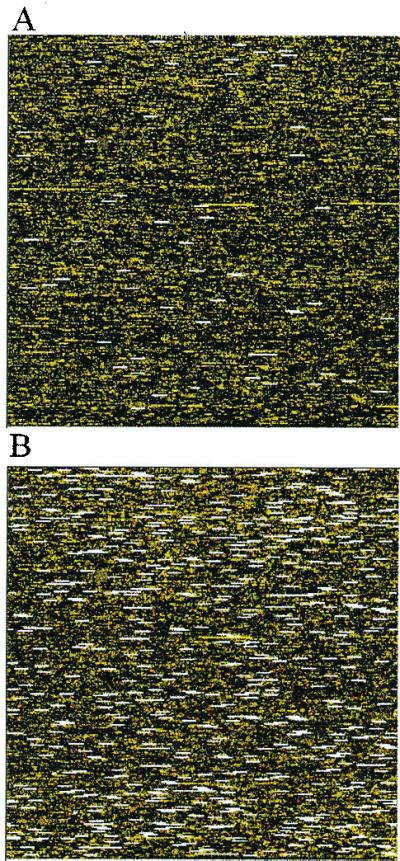
(A) A typical array (array 5) with array outliers (white bars) and single outliers (red dots) marked. (B) Array 4 has an unusually large number of array and single outliers, indicative of possible sample contamination.

(A) A typical array (array 5) with array outliers (white bars) and single outliers (red dots) marked. (B) Array 4 has an unusually large number of array and single outliers, indicative of possible sample contamination.