FIG. 3.
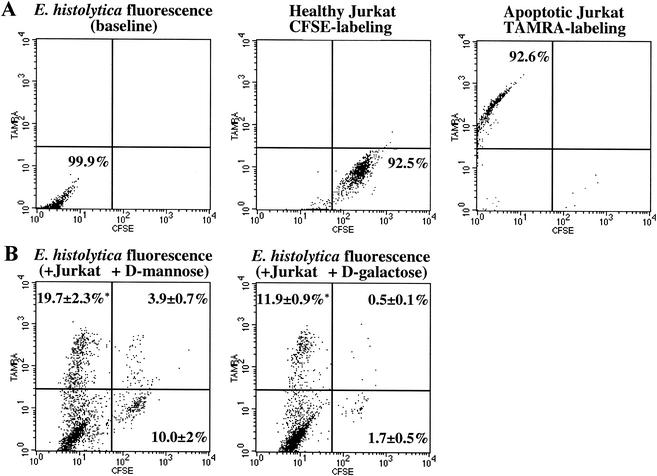
FACS analysis showing phagocytosis of healthy and apoptotic Jurkat cells by NH4Cl-treated E. histolytica trophozoites. Amebic phagocytosis was measured by flow cytometry following coincubation of amebae with CFSE-labeled healthy (green) and TAMRA-labeled apoptotic (red) Jurkat cells (E. histolytica-healthy Jurkat-apoptotic Jurkat cell ratio, 1:1:1; 37°C, 10 min). (A) Two-color dot plots showing TAMRA and CFSE fluorescence of amebae and healthy or apoptotic Jurkat cell populations. (B) Representative two-color dot plots showing amebic fluorescence following incubation with both labeled Jurkat cell populations in the presence of 50 mM d-mannose (osmotic control, left) or 50 mM d-galactose (right). Values are percentages of amebae positive for phagocytosis of apoptotic (upper left), healthy (lower right), or both apoptotic and healthy (upper right) cells (mean and SD, n = 3). Asterisks indicate a P value of <0.006 for comparisons with ingestion of healthy cells.

