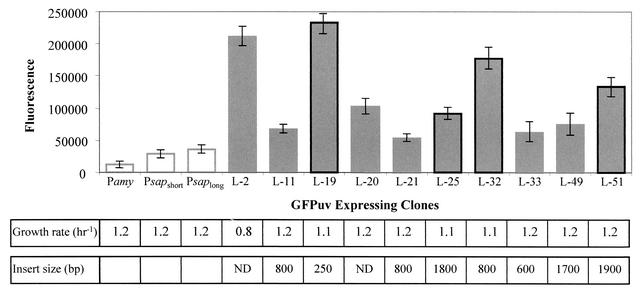
FIG. 4.
Comparison of GFPuv fluorescence emitted by selected individual B. anthracis library isolates. Fluorescence analysis of cultures from 10 clones, which exhibited high fluorescence, compared to cultures expressing gfpuv under the control of the Pamy, Psapshort, and Psaplong promoters is depicted by the bar diagrams. All measurements were determined in cultures of identical densities. The growth rates (determined by growth curves similar to those shown in Fig. 3) and insert size (determined by PCR analysis) are indicated in the table. Four library isolates, L-19, L-25, L-32, and L-51, indicated by bold-frame histograms, were selected for sequence analysis. ND, not detected. The error bars indicate standard deviations.

