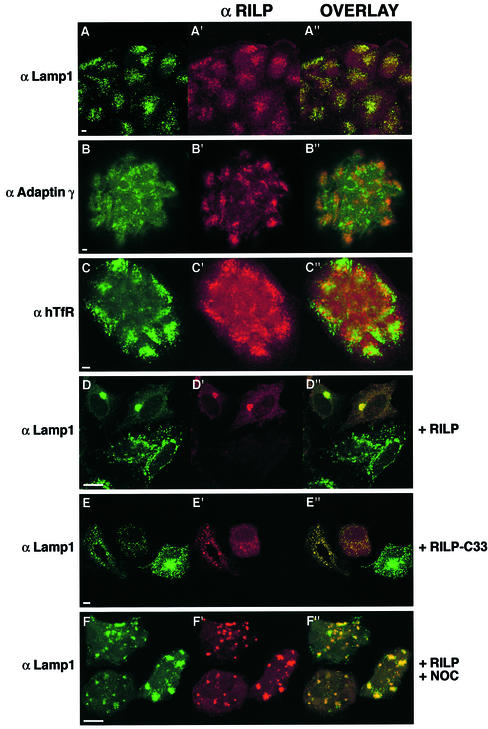
Fig. 5. Confocal immunofluorescence analysis of cells expressing endogenous or high levels of RILP. Low magnification fields of several CaCo2 cells stained with anti-RILP at a dilution of 1:10 (A′, B′ and C′; red) and anti-Lamp1 (A; green), anti-adaptin γ (B; green) or anti-hTfR (C; green). HeLa cells transfected for 5 h with RILP (D and F) or RILP-C33 (E) and stained with anti-RILP at a dilution of 1:1000 (D′, E′ and F′; red) and with anti-Lamp1 (D–F; green). In (F), cells were treated for 30 min with 10 µM nocodazole after transfection. A few cells are shown in each field. The overlays of the two colors are in (A′′–F′′). Coverslips were viewed with a Leica confocal microscope. Bars = 10 µm.

An official website of the United States government
Here's how you know
Official websites use .gov
A
.gov website belongs to an official
government organization in the United States.
Secure .gov websites use HTTPS
A lock (
) or https:// means you've safely
connected to the .gov website. Share sensitive
information only on official, secure websites.
