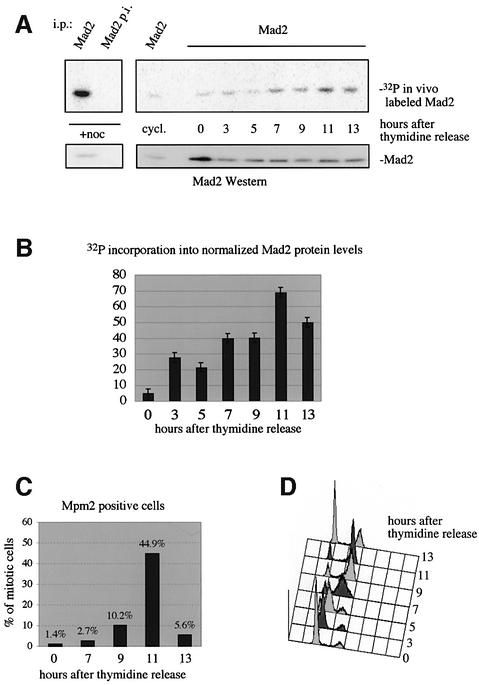
Fig. 2. In vivo phosphorylation of Mad2 is regulated during the cell cycle. In vivo-labeled Mad2 was immunoprecipitated with pre-immune serum (Mad2 p.i.) and anti-Mad2 serum (Mad2) and analyzed as described. Cells were pre-synchronized with aphidicolin in S-phase, arrested with thymidine and released from the thymidine block. Five times more cell extract was used at time point 0 to visualize the very weak signal of Mad phosphorylation in early S-phase. (A) SDS–PAGE analysis to visualize incorporation of phosphate into Mad2 (upper panel) and a Mad2 western blot (lower panel) to control for Mad2 protein levels. (B) Quantitation of phosphate incorporation into normalized Mad2 protein levels. (C) Cells staining positive for the Mpm2 epitope. (D) FACS analysis of the thymidine release. An aliquot of the release, which was not metabolically labeled but otherwise treated exactly the same way, was taken for FACS analysis.

An official website of the United States government
Here's how you know
Official websites use .gov
A
.gov website belongs to an official
government organization in the United States.
Secure .gov websites use HTTPS
A lock (
) or https:// means you've safely
connected to the .gov website. Share sensitive
information only on official, secure websites.
