
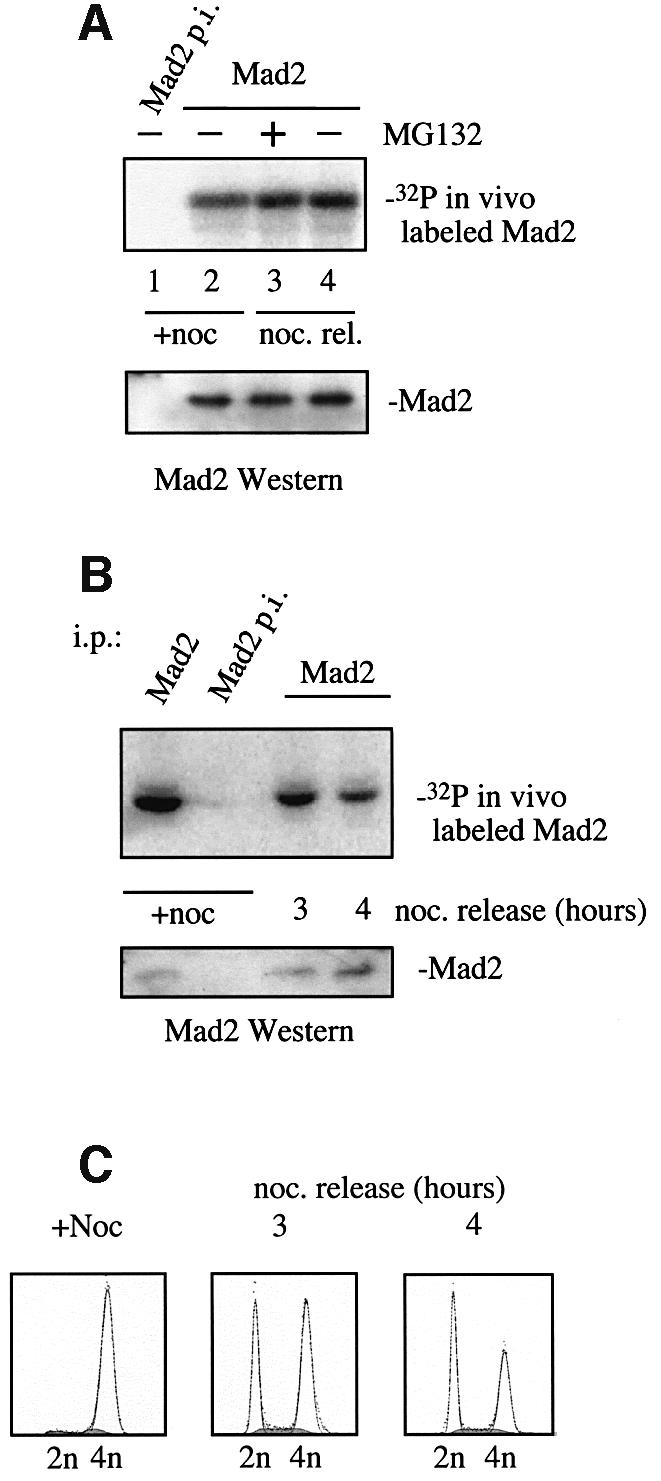
Fig. 3. HeLa cells were metabolically labeled as described in Figure 2. (A) Cells were arrested with nocodazole for 18 h and released for 1 h (noc. rel.) into medium containing the proteasome inhibitor MG132 where indicated. Shown is the phosphorylation of Mad2 after immunoprecipitation visualized on SDS–PAGE (upper panel) and Mad2 western blot (lower panel). (B) Cells were arrested with nocodazole for 18 h in metaphase and released for the time indicated. Phosphorylation of Mad2 after immunoprecipitation visualized on SDS–PAGE (upper panel) and Mad2 western blot (lower panel). (C) FACS profiles of the cells released from the nocodazole block in (B) at the indicated time points.