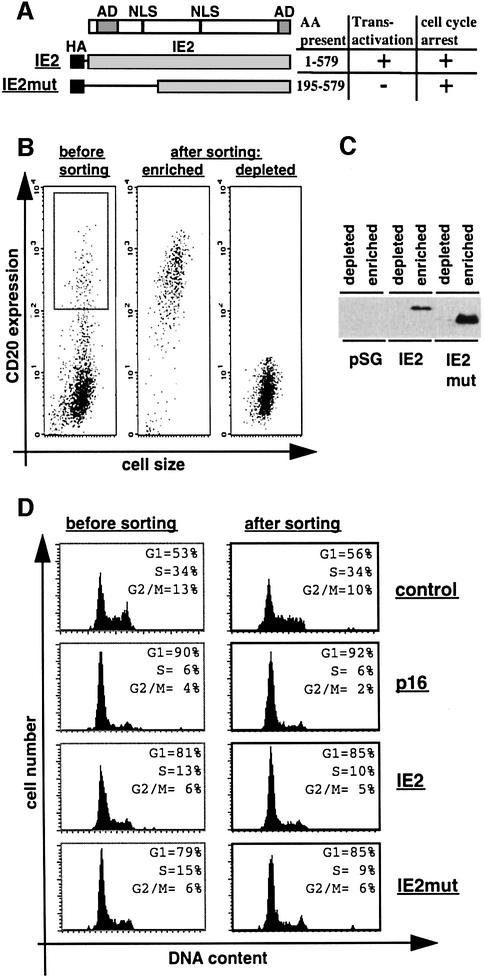
Fig. 2. Physical separation of IE2-expressing cells. U373 cells were transfected with the empty expression vector pSG5-3HA (control) or plasmids expressing p16INK4a (p16), HA-tagged full-length IE2 (IE2) or a HA-tagged IE2 deletion mutant (IE2mut). A CD20 expression vector was included in all transfections in a 1:4 molar ratio. Cells were harvested 48 h after transfection and stained with FITC-anti-CD20 antibody. Following this, cells were separated in fractions enriched for or depleted of CD20-positive cells by anti-CD20-directed MACS. (A) Schematic of IE2 and IE2mut. The amino acids (AA) present in each construct are indicated. AD, transcriptional activation domain; NLS, nuclear localization signal. (B) CD20 expression (measured as FITC fluorescence) of transfected cell populations before or after sorting was plotted against cell size (measured as forward scatter). (C) Equal amounts of extracts from sorted cells were separated by SDS–PAGE and analysed by immunoblotting with an anti-HA antibody. (D) DNA histograms show CD20-positive cell populations in which the relative DNA content (measured by PI staining) was plotted against cell number. The left panel is generated from gated [gate is shown in (B)] but unsorted cells, the right panel from sorted cells [the ‘enriched population’ in (B)]. Data shown in (B), (C) and (D) are from a single experiment representative of multiple cell separations with similar results.

An official website of the United States government
Here's how you know
Official websites use .gov
A
.gov website belongs to an official
government organization in the United States.
Secure .gov websites use HTTPS
A lock (
) or https:// means you've safely
connected to the .gov website. Share sensitive
information only on official, secure websites.
