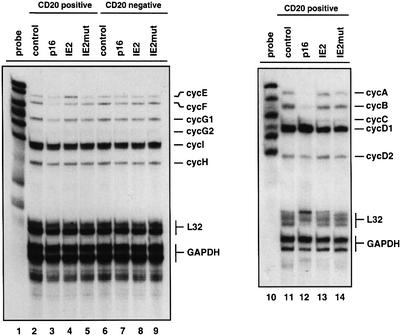
Fig. 3. Analysis of cyclin transcription in IE2-expressing cells. U373 cells were transfected and sorted as described in Figure 2. After isolation of RNAs from sorted cells mRNA expression levels of the indicated cyclins were determined by multiprobe ribonuclease protection assay. As loading controls, probes for L32 and GAPDH were included in each assay.

An official website of the United States government
Here's how you know
Official websites use .gov
A
.gov website belongs to an official
government organization in the United States.
Secure .gov websites use HTTPS
A lock (
) or https:// means you've safely
connected to the .gov website. Share sensitive
information only on official, secure websites.
