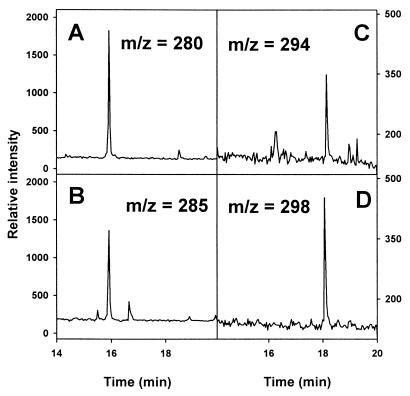
Figure 5.
Analysis of HAVA and HACA in an oxidized GS sample. The sample was reduced, spiked with d5-HAVA and d4-HACA, hydrolyzed, and derivatized as described in Material and Methods. SIM traces with m/z = 280, 285, 294, and 298 correspond to HAVA, d5-HAVA spike, HACA, and d4-HACA spike, respectively.

