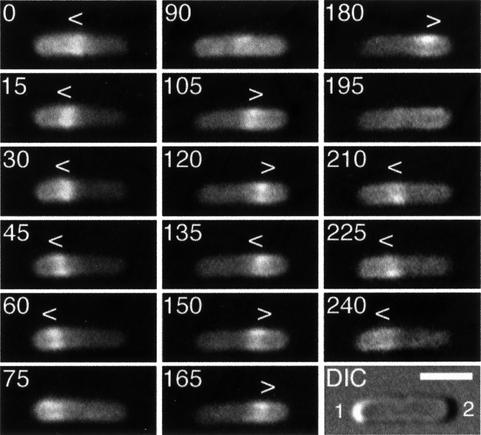
Fig. 3. Localization cycle of MinE–GFP in live cells. Fluorescence time-lapse images showing the dynamic behavior of MinE–GFP in a typical cell of strain HL1/pDR112 [ΔminDE/Plac:: minD, minE-gfp]. Cells were grown in the presence of 100 µM IPTG and displayed a Min– division pattern (see text). Fluorescence images represent a complete MinE–GFP localization cycle. Times are indicated in seconds. Note the accumulation of MinE–GFP in the shape of a ring (the E-ring) as well as in a peripheral extra-annular pattern (PEA signal), which is present between the ring and one of the cell poles. Note the net movement of a ring towards the pole with the PEA signal (0–75, 105–180 and 210–240 s), the disappearance of a ring and PEA signal when the former approaches a cell pole (90 and 195 s), and the subsequent assembly of a new ring at or near midcell concomitant with the appearance of a new PEA signal between the new ring and the pole previously devoid of signal (0, 105 and 210 s). Arrowheads (< or >) indicate both the position of the ring and the direction of its movement. During the 135–150 s interval, the ring appeared to reverse direction for a short instance, a rare phenomenon that we observed only occasionally. In the DIC panel, the cell poles are numbered 1 and 2, arbitrarily (see text), and the bar represents 2 µm.

An official website of the United States government
Here's how you know
Official websites use .gov
A
.gov website belongs to an official
government organization in the United States.
Secure .gov websites use HTTPS
A lock (
) or https:// means you've safely
connected to the .gov website. Share sensitive
information only on official, secure websites.
