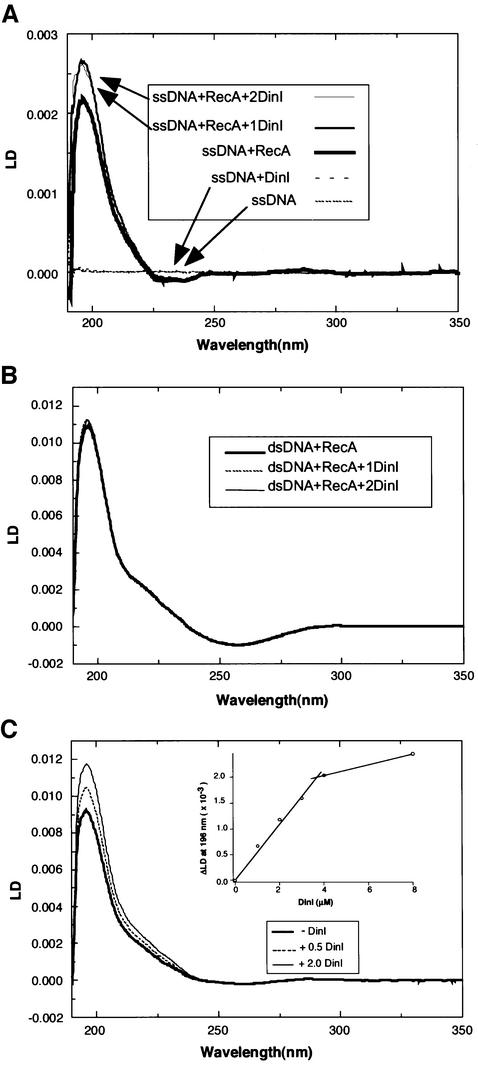
Fig. 6. Effect of DinI on the LD signal of RecA–DNA–ATPγS complexes. LD was measured with a shear force of 60/s (A and C) or 20/s (B) at 20°C. (A) poly(dεA) (12 µM in nucleotides) was mixed with 4 µM RecA alone or plus DinI (4 or 8 µM). The curves of ssDNA alone or with DinI are almost at baseline. (B) RecA (4 µM) and calf thymus dsDNA (12 µM) were mixed with or without DinI (8 µM). All the curves are almost superimposed. (C) RecA (4 µM) and poly(dT) (12 µM) were mixed with 1, 2, 3, 4 or 8 µM DinI. Only the spectra for RecA alone or with DinI added at 0.5 or 2.0 molar ratio are shown. In the inset of (C), the LD value at 196 nm was plotted against the molar ratio of DinI added to RecA.

An official website of the United States government
Here's how you know
Official websites use .gov
A
.gov website belongs to an official
government organization in the United States.
Secure .gov websites use HTTPS
A lock (
) or https:// means you've safely
connected to the .gov website. Share sensitive
information only on official, secure websites.
