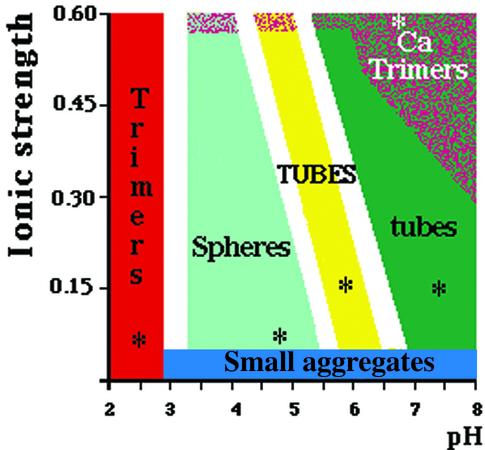
Fig. 1. Phase diagram (pH and ionic strength) of VP6. The portions of the phase diagram where a particular assembly is the major constituent have been colored as follows: red, acidic trimer; light green, spheres; yellow, 75-nm-diameter tubes (TUBES); dark green, 45-nm-diameter tubes (tubes). When CaCl2 (or ZnCl2) is used to increase the ionic strength, up to a concentration of 100–200 mM, the phase diagram is similar to that obtained with NaCl. Above this concentration, calcium (or zinc) ions destabilize the assemblies and only VP6 trimers are present in solution (Ca trimers). More than 100 conditions were explored to determine this diagram. The white areas represent the uncertainty boundaries. The asterisks indicate conditions for which a particular assembly can be considered as a pure constituent.

An official website of the United States government
Here's how you know
Official websites use .gov
A
.gov website belongs to an official
government organization in the United States.
Secure .gov websites use HTTPS
A lock (
) or https:// means you've safely
connected to the .gov website. Share sensitive
information only on official, secure websites.
