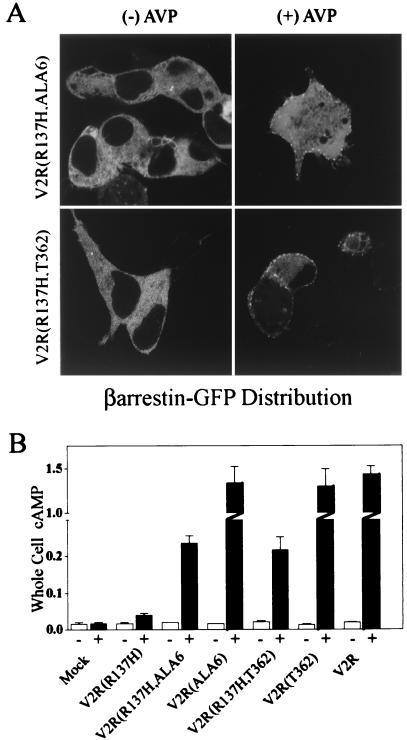
Figure 6.
βarrestin2-GFP translocation and adenylyl cyclase response of V2R, V2R(R137H,Ala6), and V2R(R137H,T362) in HEK-293 cells. (A) In the absence of agonist (Left), GFP fluorescence is cytosolic. Following exposure of the cells to 100 nM AVP for 30 min at 37°C, GFP fluorescence redistributes to punctate areas of plasma membrane (Right). (B) Cells were treated with vehicle or 2.5 μM AVP for 15 min, and whole cell cAMP was determined as described in Experimental Procedures. The absolute basal and stimulated cAMP responses were presented in units of (counts of [3H]cAMP per min per well)/(counts of [3H]adenine uptake per minute per well) and were mock (0.019 ± 0.009, 0.017 ± 0.006, n = 3); V2R(R137H) (0.018 ± 0.0045, 0.040 ± 0.008, n = 4); V2R(R137H,Ala6) (0.020 ± 0.0017, 0.23 ± 0.040, n = 4); V2R(Ala6) (0.017 ± 0.0006, 1.3 ± 0.31, n = 3); V2R(R137H,T362) (0.022 ± 0.0056, 0.22 ± 0.070, n = 4); V2R(T362) (0.015 ± 0.0021, 1.3 ± 0.34, n = 3); and V2R (0.021 ± 0.0024, 1.4 ± 0.19, n = 4). Data are expressed as the mean ± SD of three to four separate experiments.

