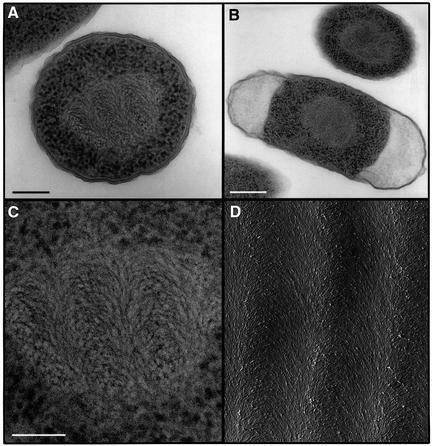
Fig. 4. Electron microscopy of Dps– cells and of an in vitro DNA cholesteric phase. (A and B) Dps– cells from cultures incubated for 6 days following the onset of a stationary phase, exhibiting a cholesteric DNA organization. Dps– bacteria harvested following shorter incubation periods revealed morphological patterns identical to those exhibited by wild-type E.coli at mid-logarithmic phase. (C) Magnification of the central region of the cell depicted in (A). Scale bars in (A), (B) and (C) are 150, 300 and 100 nm, respectively. (D) Electron micrograph (provided by Dr A.Leforestier) of an in vitro cholesteric phase of pure DNA molecules (146 bp; 200 mg/ml). The sample has been freeze-fractured following cryo-fixation at an oblique angle to the cholesteric stratification (Leforestier and Livolant, 1993). The nested arcs that characterize the cholesteric phase are detected in both the in vivo and in vitro samples.

An official website of the United States government
Here's how you know
Official websites use .gov
A
.gov website belongs to an official
government organization in the United States.
Secure .gov websites use HTTPS
A lock (
) or https:// means you've safely
connected to the .gov website. Share sensitive
information only on official, secure websites.
