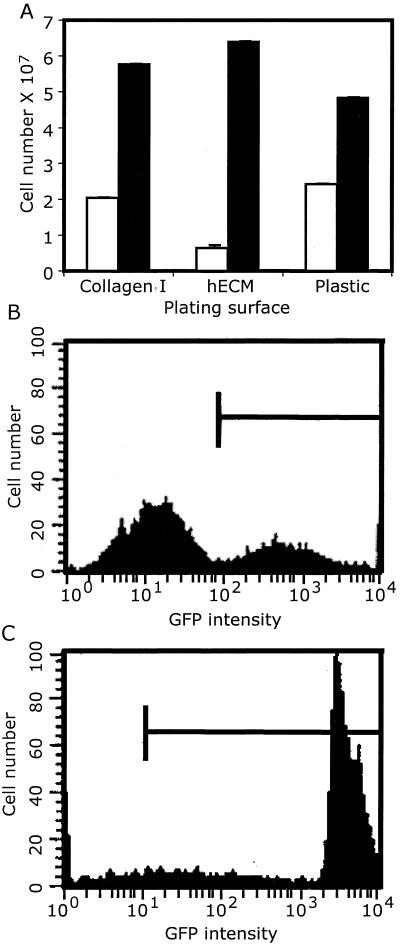
Figure 1.
EBD cell proliferation rate and flow cytometric (fluorescence-activated cell sorting) analyses. (A) 1 × 10⁴ cells from EBD culture SL grown 6 days in RPMI/15% serum (unshaded bars) or EGM2MV media (shaded bars) on three plating surfaces then trypsinized and counted. Fluorescence-activated cell sorting analyses of retroviral (B) and lentiviral (C) transduction efficiency and EGFP expression level. Bars indicate levels above background.

